Properties
Soil Properties
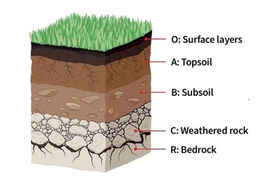
Soil properties vary from location to location due to the massively heterogeneous nature of soil. As Hans Jenny described back in 1941, a soil's composition is a function of climate, organisms, relief, parent material, time, and various additional factors he had not considered at the time that we are just beginning to learn about [1]. Soil properties vary largely by soil horizons, as shown in Figure 1; in general, the O-A-B-C-R layering is common, although variations do exist.

Soil horizons are layers that lay parallel to the Earth's surface, and to one another. The O horizon contains organic material and relatively undecomposed litter. Beneath is the A horizon, is a dark layer that is often referred to as topsoil and/or humus. It is within this layer where the most biological activity occurs in the form of plants, bacteria, archaea, and numerous macroinvertebrates. Following is the B layer, also known as the subsoil, where considerable amounts of soil nutrients and illuvium (material leached from one soil horizon and deposited in another, usually via rainwater) accumulate. Next is the C layer, consisting of notably unweathered parent material of soils. The final layer is the bedrock, or the R layer, which is similarly composed of unweathered materials due to a lack of exposure to various pedogenetic factors (like physical weathering from rainwater and the action of most macroinvertebrates) [2]. However, up to 35% of soil bacteria are found more than 2 meters below the surface, which means that microorganisms play a role in the formation and properties of each horizon.
Soil Texture
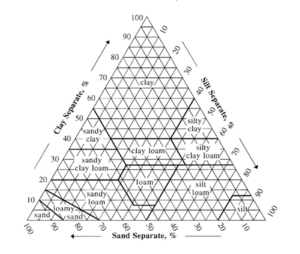
Soil is usually named by its texture, or its dominant grain size [3], which refers to the diameter of a singular grain of sediment. The soil triangle (Figure 2) only becomes useful once the soil makeup has been determined by percentage of each grain size.

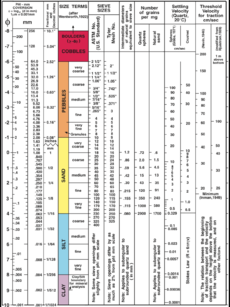
Figure 3 illustrates the terminology for grain size from the United States Geological Survey (USGS), from largest (boulders) to smallest (clay) [4]. Particle size is indirectly related to surface area. Since clays have the smallest particles, they have the most surface area and therefore retain large amounts of water [5]. On the contrary, sandy soils drain quickly and retain little water.

Soil texture influences water percolation and nutrient retention. Although clay retains more water than other soils, it does not readily provide this water to surrounding plant roots as others do. Furthermore, clay particles in heterogeneous soils are responsible for much of the nutrient retention [5]. Clay is a major actor in a soil's ability to retain nutrients and make them readily available for root uptake due to its polarity and structure [6]. Clay also has enormous adsorption potential of pollutants.
Structure
The structure of the soil refers to the way in which the soil solids are organized in relation to one another. Soil particles clump together to form aggregates, and the size and stability of these aggregates depend on factors such as mineral composition, texture, moisture availability, and soil management factors [7]. Aggregates clump together, and the way in which they align themselves indicates soil structure. There are four major types of soil structure: platelike, prism-like, blocklike, and spheroidal. Platelike structures are often found in compressed soils [8], can exist at any horizon, and have horizontal layers to them, like dinner plates stacked on top of one another. Prismlike structures have vertical tube-like prisms that vary slightly and can be broken into prismatic (angular sides and tops) and columnar (rounded tops). Prismlike structures are usually found in lower horizons. Soil structures that are blocklike (blocky) can either be cubelike or subangular. These are common in humid regions. Spheroidal soils can either be granular or crumb, depending on their porosity (granular being porous while crumb being very porous) [6]. Soil structure influences water infiltration rates. Due to larger pore spaces, blocky and spheroidal soils have higher infiltration rates due to the large pore spaces between particles, while platy and prismatic have moderate-slow infiltration rates. Soil with larger aggregates yields plants with coarse roots, while finer soil aggregates yield finer roots. This influences uptake of certain nutrients but not others, as nitrates move quickly through water, but phosphorous intake is higher on finer rooted plants [9].
Color

The most widely accepted color identification system- utilized as an important tool across several fields, from painting to soil science- is the Munsell color system [10]. The Munsell charts made specifically for soils, found within the Munsell Soil Color Book, focus predominantly on reds and yellows [11]. There are three parameters to soil color identification by the Munsell system. The hue indicates the general color of the sample, such as red, yellow, green, etc. A color's value is how light or dark it is. Lastly, the chroma is how weak or strong (vibrant) the color is [12].
The color of soil is indicative of what the soil is made up of, and what its mineral content is. For example, the soil at the A horizon is usually a dark brown, which is a result of the breakdown of organic matter and the oxidation of soil nutrients. Whiteish soils indicate a high concentration of calcium or magnesium carbonates and other soluble salts.
Soil pH

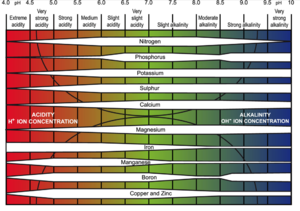
A solution's pH is a measurement of how many hydrogen ions are present on a logarithmic scale of 1-14, where 7.0 is neutral, anything less than 7.0 is acidic, and anything over 7.0 is basic (alkaline). Calcium carbonate (CaCO3), commonly known as limestone, indicates an alkaline soil, or one with a pH > 7.3 [13]. The availability of micronutrients and nitrogen, phosphorous, and potassium are affected by soil pH levels. For example, micronutrients such as manganese, iron, copper, and zinc tend to decrease in availability as soil pH increases [14]. Nitrification is also slow in acidic soils.
Adding lime to soil increases soil pH and neutralizes acidic soils, making them more suitable for agriculture [13]. According to the US Department of Agriculture, benefits of liming acidic soils include improvement of microbial activity, soil structure, nitrogen fixation in legumes, and some nutrient availability, and reduces the possibility of Mn2+ and Al3+ toxicity. Liming also increases potassium availability [14]. However, liming soils is not always necessary, as different crops have varying tolerances and preferences to acidity in soils [13].
References
[1] Amundson, Ronald, and Hans Jenny. "On a State Factor Model of Ecosystems." BioScience, vol. 47, no. 8, 1997, pp. 536-543., doi:10.2307/1313122.
[2] "Appendix 1: Soil Horizon Designations." World Reference Base for Soil Resources, Food and Agricultural Organization of the United Nations, 1998, www.fao.org/docrep/W8594E/w8594e0g.htm.
[3] "Soil Texture Calculator." NRCS Soils, USDA Natural Resources Conservation Service, www.nrcs.usda.gov/wps/portal/nrcs/detail/soils/survey/?cid=nrcs142p2_054167.
[4] Wentworth, Chester K. "A Scale of Grade and Class Terms for Clastic Sediments." The Journal of Geology, vol. 30, no. 5, 1922, pp. 377-392., doi:10.1086/622910.
[5] Sheard, R.W. "Understanding Turf Management." Michigan State University Archives, 4 Sept. 1991, archive.lib.msu.edu/tic/stnew/article/1991sep4.pdf.
[6] "Fundamentals of Soil Ecology." Fundamentals of Soil Ecology, by D. C. Coleman, 2nd ed., Elsevier, 2004, pp. 1-21.
[7] Lal, R., editor. "Soil Structure and Organic Carbon: a Review." Soil Processes and the Carbon Cycle, by B.D. Kay, CRC Press, 1998, pp. 169-197.
[8] Pagliai, M., et al. "Soil Structure and the Effect of Management Practices." Soil and Tillage Research, vol. 79, no. 2, 2004, pp. 131-143., doi:10.1016/j.still.2004.07.002.
[9]Wiersum, L. K. "Uptake of Nitrogen and Phosphorus in Relation to Soil Structure and Nutrient Mobility." Plant and Soil, vol. 16, no. 1, 1962, pp. 62-70., doi:10.1007/bf01378158.
[10] "The Color of Soil." The Color of Soil | NRCS Soils, United States Department of Agriculture, web.archive.org/web/20071027060221/http://soils.usda.gov/education/resources/k12/less ons/color/.
[11] "Munsell Soil Color Charts." Munsell Color System; Color Matching from Munsell Color Company, munsell.com/color-products/color-communications-products/environmental- color-communication/munsell-soil-color-charts/.
[12] "How to Read a Munsell Color Chart." Munsell Color System; Color Matching from Munsell Color Company, munsell.com/about-munsell-color/how-color-notation-works/how-to-read-color-chart/.
[13] "Soil Quality - Agronomy Technical Note No. 8: Liming to Improve Soil Quality in Acid Soils." Natural Resources Conservation Service, United States Department of Agriculture, www.nrcs.usda.gov/Internet/FSE_DOCUMENTS/nrcs142p2_053252.pdf.
[14] Government of Alberta, Alberta Agriculture and Forestry, Livestock and Crops Division, Crop Research and Extension Branch, Food and Bio-Industrial Crops Section. "Soil PH and Plant Nutrients." Alberta Agriculture and Forestry, 15 May 2003, www1.agric.gov.ab.ca/$department/deptdocs.nsf/all/agdex6607.
[15] "Soil Geomorphology and Identification." Stevens Water, 16 Mar. 2017, www.stevenswater.com/blog/post/?permalink=soil-geomorphology-and-identification.
[16] Wentworth grain size chart from United States Geological Survey Open-File Report 2006- 1195, "Surficial sediment character of the Louisiana offshore continental shelf region: A GIS Compilation" by Jeffress Williams, Matthew A. Arsenault, Brian J. Buczkowski, Jane A. Reid, James G. Flocks, Mark A. Kulp, Shea Penland, and Chris J. Jenkins
[17] Soil Analysis: Key to Nutrient Management Planning.” Potash Development Association (PDA), www.pda.org.uk/pda_leaflets/24-soil-analysis-key-to-nutrient-management-planning/.