Foraging: Difference between revisions
| Line 11: | Line 11: | ||
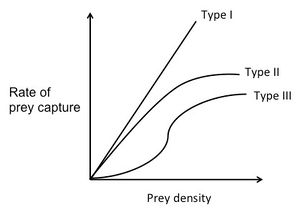
[[File:Functional response curve.jpg|300px|thumb|left|Functional Response Curve. Source: Staddon, J.E.R., 1983.]] | [[File:Functional response curve.jpg|300px|thumb|left|Functional Response Curve. Source: Staddon, J.E.R., 1983.]] | ||
The search time depends on the density of prey. Functional response curves are used to plot the rate of prey capture over the prey density. There are type 1, type 2, and type 3 response curves. In type 1, there is a linear relationship between rate of prey captured and prey density. As the rate of prey capture increases, so does prey density. In type 2 response curves, the rate of prey captured increases with prey density to a point, and then flattens out because the predators become satiated. In type 3 response curves, rate of prey capture is high at low prey densities because the predators are more generalists and eat whatever is most abundant. At high prey densities, the predators will become specialists and pick the prey that is the most beneficial, not just the most abundant. | The search time depends on the density of prey. Functional response curves are used to plot the rate of prey capture over the prey density. There are type 1, type 2, and type 3 response curves. In type 1, there is a linear relationship between rate of prey captured and prey density. As the rate of prey capture increases, so does prey density. In type 2 response curves, the rate of prey captured increases with prey density to a point, and then flattens out because the predators become satiated. In type 3 response curves, rate of prey capture is high at low prey densities because the predators are more generalists and eat whatever is most abundant. At high prey densities, the predators will become specialists and pick the prey that is the most beneficial, not just the most abundant. | ||
https://www.sciencedirect.com/science/article/pii/S003140560470075X | https://www.sciencedirect.com/science/article/pii/S003140560470075X | ||
Revision as of 00:38, 9 May 2018
Many animals forage in the soil, looking for food such as plants or smaller organisms.
Optimal Foraging Theory
The optimal foraging theory predicts how a foraging animal will behave when presented with a choice in its prey. This theory takes into account not only the energy the organism receives from the prey, but also the energy and time it costs to forage for the prey. Animals want to receive the greatest benefit of energy while expending the least amount of their own time and energy. The goal of this theory is to find the foraging strategy that maximizes the energy the species receives under the constraints of it's environment. These constraints can include how long it takes for the animal to travel to the foraging sites, how long it takes to search for the prey, how long it takes for the animal to prepare its foraged prey for eating, along with other factors. The optimal diet model can be used to find the optimal foraging strategy.
Optimal Diet Model
In this model, predators have to decide whether to eat the prey they find or look for another, hopefully more profitable, source of prey. Animals have to choose between big prey and large prey. They do this by considering the handling time (how long it takes to prepare the prey for eating), search time, and energy they would gain. To determine the profitability in this model, the value of energy the animal will receive should be divided by the handling time. The prey with the larger number is more profitable. However, if the predator comes across one prey and has to decide whether to eat it or look for another source of prey, search time for that second prey has to be taken into consideration. If the the energy value divided by the handling time plus the search time of the second prey is greater than the energy value divided by the handling time of the first prey, then the animal should search for the other source of prey. Shown in an equation, the animal should only search for the second source of prey if E2/(h2+S2) > E1/h1. In this equation E1 and E2 are the energy values benefited from prey 1 and prey 2, respectively, h1 and h2 are the handling time of prey 1 and prey 2, and S2 is the search time for prey 2. If S2 is in a certain value threshold, the animal will eat both prey. These animals that eat both prey are often generalists, while animals that do not are often specialists.

The search time depends on the density of prey. Functional response curves are used to plot the rate of prey capture over the prey density. There are type 1, type 2, and type 3 response curves. In type 1, there is a linear relationship between rate of prey captured and prey density. As the rate of prey capture increases, so does prey density. In type 2 response curves, the rate of prey captured increases with prey density to a point, and then flattens out because the predators become satiated. In type 3 response curves, rate of prey capture is high at low prey densities because the predators are more generalists and eat whatever is most abundant. At high prey densities, the predators will become specialists and pick the prey that is the most beneficial, not just the most abundant.
https://www.sciencedirect.com/science/article/pii/S003140560470075X